
![]()
![]()
![]()
EquityTool: December 18, 2025
The EquityTool has been updated based upon new source data.
The original version is no longer active but is available upon request.
Previous version released: April 7, 2017
Source data: DHS 2023
# of survey questions in full wealth index: 48
# of variables in full index: 163
# of survey questions in EquityTool: 19
# of variables in EquityTool: 20
Questions:
| Question | Option 1 | Option 2 | Option 3 | |
| DETERMINE IF THE RESPONDENT LIVES IN AN URBAN OR RURAL AREA | Urban | Rural | ||
| Q1 | Does your household have … a washing machine? | Yes | No | |
| Q2 | … a vacuum cleaner? | Yes | No | |
| Q3 | … a refrigerator? | Yes | No | |
| Q4 | … a microwave? | Yes | No | |
| Q5 | … a table? | Yes | No | |
| Q6 | … a chair? | Yes | No | |
| Q7 | … a sofa/divan? | Yes | No | |
| Q8 | … a bed? | Yes | No | |
| Q9 | … an electric fan? | Yes | No | |
| Q10 | … an indoor heater? | Yes | No | |
| Q11 | … an electric water heater? | Yes | No | |
| Q12 | Does the household own land usable for agriculture? | Yes | No | |
| Q13 | Does any member of this household own … a watch? | Yes | No | |
| Q14 | … a car? | Yes | No | |
| Q15 | What does this household use to heat the home when needed? | Traditional cookstove | Other | |
| Q16 | In your household, what type of cookstove is mainly used for cooking? | Liquefied petroleum gas (LPG)/ cooking gas stove | Other type of cookstove | |
| Q17 | What is the main source of drinking water for members of your household? | Piped into the dwelling | Other source of drinking water | |
| Q18 | What kind of toilet facility do members of your household usually use? | Flush to piped sewer system | Pit latrine with slab | Other type of toilet |
| Q19 | What is the main material of the walls of the dwelling? | Brick | Other material |
Technical notes:
We were unable to achieve agreement of kappa ≥ 0.75 between the original DHS wealth index and a simplified index using our standard simplification process (detailed in this article). Using a revised approach, detailed below, high agreement (kappa ≥ 0.75) for both urban and national indices was achieved.
The national factor weights used in that approach come from an analysis of the national population and contain only those variables which are related to the construct of wealth in the same way in both rural and urban areas. The national factor weights are usually used in EquityTools to calculate national quintiles, as they reduce some known areas of respondent error in the survey.
However, to overcome the problem of low agreement using the standard simplification approach, we instead used factor weights from the rural and urban analyses, which select variables that related to wealth differently in urban and rural areas. For example, in an urban area, ownership of goats may be more strongly associated with being relatively poor than in rural areas. This is the case in Tajikistan. A short list of variables, common to both urban and rural areas, were iteratively selected to find those which result in high agreement (kappa ≥ 0.75) against the original wealth index quintiles for national and urban populations.
A score from the simplified index for urban residents (Uscore) was regressed against the wealth index score variable created for the corrected full wealth index analysis (Nscore), the same was done for rural residents (Rscore), and the resulting coefficients are used to create a single national score (NatScore).
Nscore=b1Uscore + a1
Nscore=b2Rscore + a2
NatScore=b1(Uscore)(Urban)+ a1(Urban)+b2(Rscore)(Rural)+a2(Rural)
Where Urban=1 if respondent lives in an urban area and 0 if otherwise, and Rural =1 if respondent lives in a rural area and 0 if otherwise.
Respondents’ quintile assignments resulting from NatScore, the national wealth index score created from a simplified list of questions were compared to the quintile assignments resulting from the original wealth index with 20 variables using the kappa statistic.
The questions in the simplified index which resulted from this process differ from EquityTools that are created using our standard approach. Notably, we need to know whether the respondent lives in an urban or rural area, thus an additional question has been added to the EquityTool for Tajikistan: ‘Determine if the respondent lives in an urban or rural area’. In principle, the definition of ‘urban’ and ‘rural’ should match the definition used in the Tajikistan 2023 DHS. Typically, this definition is defined by the country, not the developers of the DHS. In practice, the user needs to decide how to determine if each respondent lives in an urban or rural area. Three approaches are presented below, with some notes on each. Whichever method is chosen, it should be uniformly applied across all surveys conducted.
- Ask the respondent directly – ‘is your home in an urban or rural area?’ This relies on the respondent’s understanding of ‘urban’ and ‘rural’.
- Allow the data collector to determine whether the respondent lives in an urban or rural area, based on available guidance. This will work best if the interviews take place in or very near to people’s homes, and if the data collectors can be trained on the same rules to determine if an area is urban or rural. One example of a rule is to classify ‘peri-urban’ areas on the edges of a city or town as urban. Another rule might be to classify an area as urban if it has a market center which operates daily.
- If the interviews are taking place outside the home, then classify respondents based upon the location of the interview. For example, if interviews occur in health facilities, classify respondents as urban if the facilities are located in urban areas. Individuals may travel, so this method is also subject to error.
Level of agreement:
National Population (n=8,035) | Urban only population (n=3,597) | |
| % agreement | 83.7% | 86.0% |
| Kappa statistic | 0.746 | 0.781 |
Respondents in the original dataset were divided into three groups for analysis – those in the 1st and 2nd quintiles (poorest 40%), those in the 3rd quintile, and those in the 4th and 5th quintiles (richest 40%). After calculating their wealth using the simplified index, they were again divided into the same three groups for analysis against the original data in the full DHS. Agreement between the original data and our simplified index is presented above.
What does this mean?
When shortening and simplifying the index to make it easier for programs to use to assess equity, it no longer matches the original index with 100% accuracy. At an aggregate level, this error is minimal, and this methodology was deemed acceptable for programmatic use by an expert panel. However, for any given individual, especially those already at a boundary between two quintiles, the quintile the EquityTool assigns them to may differ to their quintile according to the original DHS wealth index.
The graph below illustrates the difference between the EquityTool generated index and the full DHS wealth index. Among all of those people (20% of the population) originally identified as being in the poorest quintile, approximately 79.5% are still identified as being in the poorest quintile when we use the simplified index. However, approximately 18.5% of people are now classified as being in Quintile 2. From a practical standpoint, all of these people are relatively poor. Yet, it is worthwhile to understand that the simplified index of 20 questions produces results that are not identical to using all 48 questions in the original survey.
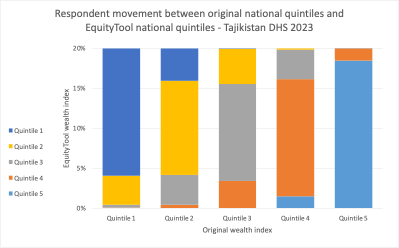
The following table provides the same information on the movement between national quintiles when using the EquityTool versus the original DHS wealth index:
| EquityTool National Quintiles | |||||||
| Quintile 1 | Quintile 2 | Quintile 3 | Quintile 4 | Quintile 5 | Total | ||
| Original DHS National Quintiles | Quintile 1 | 15.9% | 3.7% | 0.4% | 0.0% | 0.0% | 20% |
| Quintile 2 | 4.1% | 11.8% | 3.8% | 0.4% | 0.0% | 20% | |
| Quintile 3 | 0.1% | 4.4% | 12.1% | 3.3% | 0.0% | 20% | |
| Quintile 4 | 0.0% | 0.1% | 3.7% | 14.7% | 1.5% | 20% | |
| Quintile 5 | 0.0% | 0.0% | 0.0% | 1.5% | 18.5% | 20% | |
| Total | 20.1% | 20.0% | 20.0% | 20.0% | 20.0% | 100% | |
The following graph provides information on the movement between urban quintiles when using the EquityTool versus the original DHS wealth index:
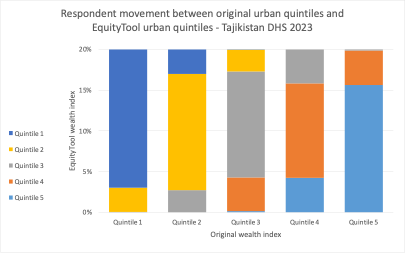
The following table provides the same information on the movement between urban quintiles when using the EquityTool versus the original DHS wealth index:
| EquityTool Urban Quintiles | |||||||
| Quintile 1 | Quintile 2 | Quintile 3 | Quintile 4 | Quintile 5 | Total | ||
| Original DHS Urban Quintiles | Quintile 1 | 17.0% | 3.0% | 0.0% | 0.0% | 0.0% | 20% |
| Quintile 2 | 3.0% | 14.3% | 2.7% | 0.0% | 0.0% | 20% | |
| Quintile 3 | 0.0% | 2.7% | 13.0% | 4.1% | 0.1% | 20% | |
| Quintile 4 | 0.0% | 0.0% | 4.2% | 11.6% | 4.2% | 20% | |
| Quintile 5 | 0.0% | 0.0% | 0.1% | 4.2% | 15.6% | 20% | |
| Total | 20.0% | 20.0% | 20.0% | 20.0% | 20.0% | 100% | |
Data interpretation considerations:
- This tool provides information on relative wealth – ‘ranking’ respondents within the national or urban population. The most recent available data from the WorldBank indicates that 7.29% of people in Tajikistan live below $3.00/day [1]. This information can be used to put relative wealth into context.
- People who live in urban areas are more likely to be wealthy. In Tajikistan, 65% of people living in urban areas are in the richest national quintile, compared to only 4% of those living in rural areas [2].
- If your population of interest is predominantly urban, we recommend you look at the urban results to understand how relatively wealthy or poor they are, in comparison to other urban dwellers.
- If the people you interviewed using the EquityTool live in rural areas, or a mix of urban and rural areas, we recommend using the national results to understand how relatively wealthy or poor they are, in comparison to the whole country.
- Some districts in Tajikistan are wealthier than others. It is important to understand the country context when interpreting your results.
- In most cases, your population of interest is not expected to be equally distributed across the five wealth quintiles. For example, if your survey interviewed people exiting a shopping mall, you would probably expect most of them to be relatively wealthy.
Changes from the previous EquityTool
We released an EquityTool on April 7, 2017 which compared user data to a benchmark of 2012 DHS. A new source survey, the 2023 DHS was recently released, and allows us to benchmark results to a more recent population. This is important, because wealth generally increases over time, and comparing your respondents to an old benchmark population will lead to over-estimating the relatively wealthy in your survey. The new EquityTool was generated using the exact same methodology as the previous version, and in generating the new EquityTool, no attempt was made to account for the fact that a previous version existed. In other words, we did not explicitly try to keep the same questions or response options as the previous tool.
Practical Considerations
For those who have not previously conducted an EquityTool based study in Tajikistan, the remainder of this section is not particularly relevant. For those who have used the previous EquityTool, you may be interested to know how the two versions compare.
| Previous | Current | |
| Source Data | 2012 DHS | 2023 DHS |
| # of questions in EquityTool | 16 | 19 |
| # of questions in full wealth index | 48 | 48 |
| # of variables in EquityTool | 17 | 20 |
| # of variables in full wealth index | 111 | 163 |
| Kappa statistic (EquityTool vs full wealth Index) for 3 groups | National: 0.756 Urban: 0.763 | National: 0.746 Urban: 0.781 |
Compared to the previous EquityTool, some of the questions and variables included have changed.
The previous EquityTool included 17 variables. Of those 17 variables, 11 are still included in the current EquityTool.
| 1. Vacuum cleaner | 7. Electric fan |
| 2. Refrigerator | 8. Car |
| 3. Table | 9. Source of drinking water: piped into dwelling |
| 4. Chair | 10. Toilet: flush to piped sewer system |
| 5. Sofa/divan | 11. Toilet: pit latrine with slab |
| 6. Bed |
8 variables are included in the new EquityTool that were not included in the previous EquityTool.
| 1. Microwave | 5. Heat: cookstove |
| 2. Indoor heater | 6. Cookstove for cooking: Liquefied petroleum gas (LPG)/ cooking gas stove |
| 3. Electric water heater | 7. Wall material: brick |
| 4. Watch | 8. Land ownership |
It is generally best to use the current version of the EquityTool, since it will give a more accurate quintile estimate. If you are currently collecting data, it is best to continue to use the previous tool. Note that if you have created a survey in the EquityTool web application using the previous EquityTool, that survey will continue to use the previous EquityTool.
If conducting a follow-up survey to a baseline that used the previous EquityTool, and the most important result is change from the baseline, it may be preferable to continue to use the previous EquityTool for comparability. If you need to do this, please contact us at support@equitytool.org.
Contextualizing Changes in the EquityTool
Comparing the results of surveys that used the previous EquityTool against those that use the current EquityTool is difficult. It will not always be clear whether any difference is because of actual differences in the wealth level of the respondents or because the EquityTool has changed.
The section below provides relevant contextual information that may help a user understand why the EquityTool has changed from the previous tool.
Changes in Asset Ownership
Over time, patterns of asset ownership change. This may reflect the fact that an asset which previously was quite expensive has become more affordable over time, making it more accessible to a large population or that the population has grown wealthier and now a larger portion of the population is able to afford more expensive goods. Likewise, some assets may simply become more or less prevalent due to technological changes. As asset ownership patterns change, their ability to help us distinguish between wealth quintiles may also change.
In Figure 1 we show how ownership of the assets in the original benchmark survey and the current benchmark survey have changed [2]. Variables that are not included in both DHS surveys are not shown in this graph. Assets in red appear in both the current and previous versions of the EquityTool.
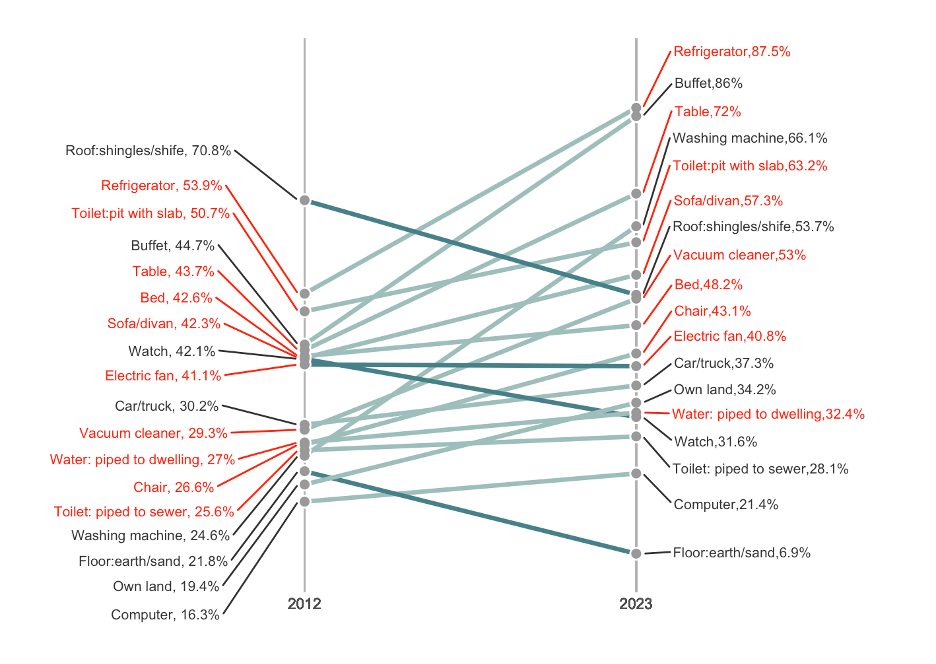
Between 2012 and 2023, Tajikistan saw notable changes in household asset ownership, with most assets experiencing increased ownership. In particular, there was a large rise in household appliances, with ownership of refrigerators, washing machines rising by more than 30 and 40 percentage points respectively. At the same time, we see large decreases in the use of certain building materials with earth/sand floors declining by nearly 15 percentage points and shingle/shife roofing declining by 17 percentage points.
Changes in Country Context
Changes in the EquityTool often reflect changes in the economic well-being of the population. As the population wealth changes, the prevalence of different assets may change.
The following table provides a summary of some key indicators which illustrate how the economic well-being of the population of Tajikistan has changed from 2012 to 2023.
| Previous Survey: DHS 2012 | Current Survey: DHS 2023 | |
| Percent of the population living below the poverty line [1] | 13.33% (2015) | 7.29% (2023) |
| Percent of the population that is multidimensionally poor [3] | 12.19% (2012) | 7.41% (2017) |
| GDP per capita [4] | $2,700 | $4,472 |
| Average annual GDP growth from 2012 to 2023 [5] | 7.23% | |
The Tajikistan economy grew between 2012 and 2023. Accompanying this economic growth has also been a decrease in the poverty headcount as measured by both the international poverty line and the Multidimensional Poverty Index. This economic improvement, over time, will reduce the previous Tajikistan EquityTool’s ability to accurately assign households to their most correct wealth quintiles.
Metrics for Management provides technical assistance services to those using the Equity Tool, or wanting to collect data on the wealth of their program beneficiaries. Please contact support@equitytool.org and we will assist you.
[1] From pip.worldbank.org, reporting poverty headcount ratio at $3.00/day at 2021 international prices.
[2] From the Tajikistan dataset household recode, available at http://dhsprogram.com/
[3] From Alkire, S., Kanagaratnam, U., and Suppa, N. (2023). A methodological note on the global Multidimensional Poverty Index (MPI) 2023 changes over time results for 84 countries. OPHI MPI Methodological Note 57, Oxford Poverty and Human Development Initiative. ©2018 University of Oxford
[4] From data.worldbank.com, reporting GDP per capita, PPP (constant 2021 international $)
[5] From data.worldbank.com, reporting average of GDP growth (annual %)
