
![]()
![]()
![]()
EquityTool: Update released March 12, 2025
The EquityTool has been updated based upon new source data. The original version is no longer active but is available upon request.
Previous version released: December 9, 2015
Source data: Dominican Republic MICS 2019
# of survey questions in original wealth index: 40
# of variables in original index: 107
# of survey questions in EquityTool: 11
# of variables in EquityTool: 14

Questions:
| Question | Option 1 | Option 2 | Option 3 | |
| Q1 | Does your household have a kitchen cabinet? | Yes | No | |
| Q2 | …sofa? | Yes | No | |
| Q3 | …an electric Iron? | Yes | No | |
| Q4 | …internet service within your home? | Yes | No | |
| Q5 | …a dining set? | Yes | No | |
| Q6 | …washing machine? | Yes | No | |
| Q7 | …a refrigerator? | Yes | No | |
| Q8 | Does any member of this household have an account in a bank or financial institution? | Yes | No | |
| Q9 | Where is your toilet facility located? | Inside the home | In own yard/plot | Other |
| Q10 | What is the main material of the roof of your dwelling? | Cement | Zinc or Asbestos | Other |
| Q11 | What is the main material of the floor of your dwelling? | Cement | Tile or Ceramic | Other |
Technical notes:
The standard simplification process was applied to achieve high agreement with the original wealth index. However, after completing the standard simplification process, an additional variable was added to improve the indices’ ability to discriminate between the first and second quintiles. Details on the standard process can be found in this article. The data used to identify important variables comes from the factor weights derived from the reconstruction of the MICS Wealth Index using analytical syntax provided by UNICEF. The MICS wealth index Dominican Republic is constructed using the same approach as the DHS Wealth Index. More information about how the DHS Wealth Index is constructed can be found here. Factor weights used in the construction of the Dominican Republic EquityTool are available upon request.
Level of agreement:
National Population (n= 31,488) | Urban only population (n= 20,932) | |
| % agreement | 84.1% | 83.7% |
| Kappa statistic | 0.752 | 0.747 |
Respondents in the original dataset were divided into three groups for analysis – those in the 1st and 2nd quintiles (poorest 40%), those in the 3rd quintile, and those in the 4th and 5th quintiles (richest 40%). After calculating their wealth using the simplified index, they were again divided into the same three groups for analysis against the original data in the full MICS wealth index.
Agreement between the original data and our simplified index is presented above.
What does this mean?
When shortening and simplifying the index to make it easier for programs to use to assess equity, it no longer matches the original index with 100% accuracy. At an aggregate level, this error is minimal, and this methodology was deemed acceptable for programmatic use by an expert panel. However, for any given individual, especially those already at a boundary between two quintiles, the quintile the EquityTool assigns them to may differ to their quintile according to the original MICS wealth index.
The graph below illustrates the difference between the EquityTool generated index and the full MICS wealth index. Among all of those people (20% of the population) originally identified as being in the poorest quintile, approximately 83.6% are still identified as being in the poorest quintile when we use the simplified index. However, approximately 15.3% of people are now classified as being in Quintile 2. From a practical standpoint, all of these people are relatively poor. Yet, it is worthwhile to understand that the simplified index of 11 questions produces results that are not identical to using all 40 questions in the original survey.

The following table provides the same information on the movement between national quintiles when using the EquityTool versus the original MICS wealth index:
| EquityTool Urban Quintiles | |||||||
| Quintile 1 | Quintile 2 | Quintile 3 | Quintile 4 | Quintile 5 | Total | ||
| Original MICS National Quintiles | Quintile 1 | 16.71% | 3.06% | 0.23% | 0.00% | 0.00% | 20% |
| Quintile 2 | 3.29% | 13.21% | 3.31% | 0.20% | 0.00% | 20% | |
| Quintile 3 | 0.01% | 3.68% | 12.25% | 3.96% | 0.10% | 20% | |
| Quintile 4 | 0.00% | 0.07% | 4.06% | 12.17% | 3.70% | 20% | |
| Quintile 5 | 0.00% | 0.00% | 0.26% | 4.27% | 15.47% | 20% | |
| Total | 20.00% | 20.03% | 20.09% | 20.60% | 19.27% | 100% | |
The following graph provides information on the movement between urban quintiles when using the EquityTool versus the original MICS wealth index:

The following table provides the same information on the movement between urban quintiles when using the EquityTool versus the original MICS wealth index:
| EquityTool Urban Quintiles | |||||||
| Quintile 1 | Quintile 2 | Quintile 3 | Quintile 4 | Quintile 5 | Total | ||
| Original MICS Urban Quintiles | Quintile 1 | 17.29% | 2.48% | 0.22% | 0.00% | 0.00% | 20% |
| Quintile 2 | 2.83% | 14.02% | 2.99% | 0.18% | 0.00% | 20% | |
| Quintile 3 | 0.01% | 3.43% | 12.12% | 4.05% | 0.38% | 20% | |
| Quintile 4 | 0.00% | 0.07% | 4.52% | 9.71% | 5.70% | 20% | |
| Quintile 5 | 0.00% | 0.00% | 0.37% | 5.71% | 13.92% | 20% | |
| Total | 20.13% | 20.00% | 20.22% | 19.65% | 20.00% | 100% | |
Data interpretation considerations:
This tool provides information on relative wealth – ‘ranking’ respondents within the national or urban population. The most recent available data from the WorldBank indicates that 0.83% of people in Dominican Republic live below $2.15/day[1]. This information can be used to put relative wealth into context.
People who live in urban areas are more likely to be wealthy. In Dominican Republic, 24.8% of people living in urban areas are in the richest national quintile, compared to only 5.8% of those living in rural areas[2].
a. If your population of interest is predominantly urban, we recommend you look at the urban results to understand how relatively wealthy or poor they are, in comparison to other urban dwellers.
b. If the people you interviewed using the EquityTool live in rural areas, or a mix of urban and rural areas, we recommend using the national results to understand how relatively wealthy or poor they are, in comparison to the whole country.
Some provinces in the Dominican Republic are wealthier than others. It is important to understand the country context when interpreting your results.
In most cases, your population of interest is not expected to be equally distributed across the five wealth quintiles. For example, if your survey interviewed people exiting a shopping mall, you would probably expect most of them to be relatively wealthy.
Changes from the previous EquityTool
We released an EquityTool on December 9, 2015 which compared user data to a benchmark of DHS 2013. A new source survey, the 2019 Dominican Republic MICS was recently released, and allows us to benchmark results to a more recent population. This is important, because wealth generally increases over time, and comparing your respondents to an old benchmark population will lead to over-estimating the relatively wealthy in your survey. The new EquityTool was generated using the exact same methodology as the previous version, and in generating the new EquityTool, no attempt was made to account for the fact that a previous version existed. In other words, we did not explicitly try to keep the same questions or response options as the previous tool.
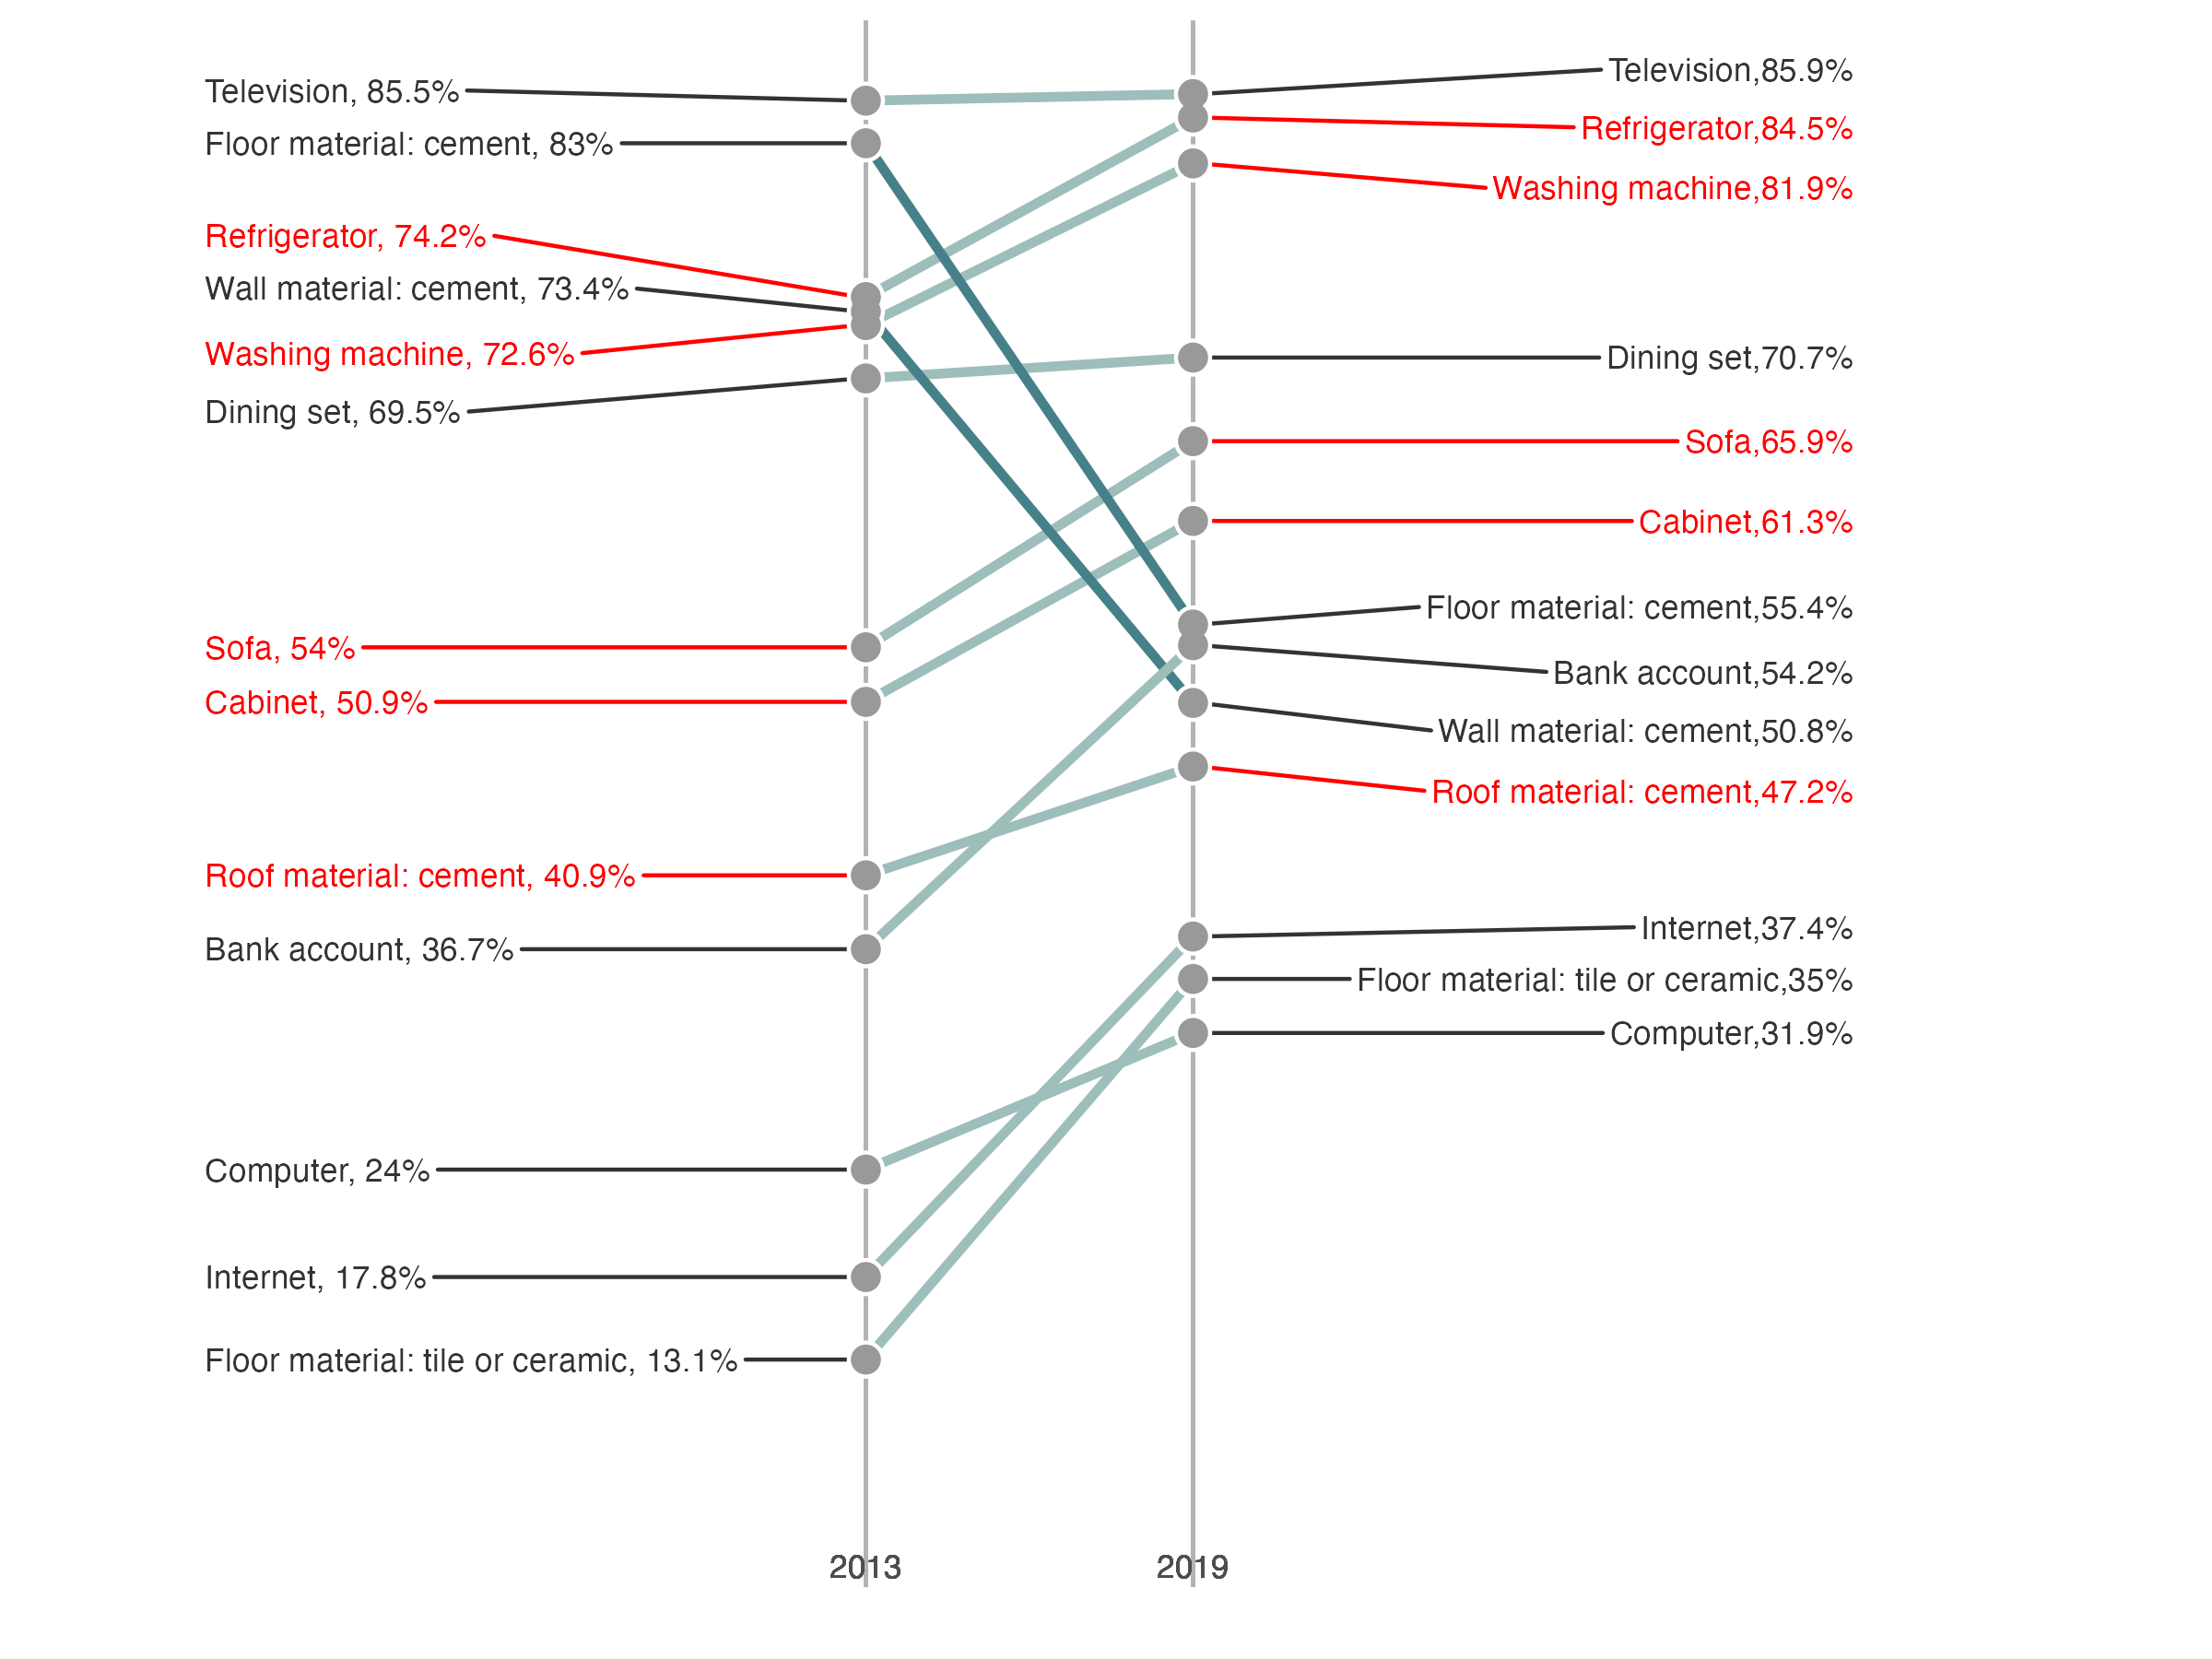
Between 2013 and 2019, there were notable changes in the Dominican Republic’s asset ownership rates. For example, the percentage of households with internet and bank account increased by nearly 20 percentage points. Conversely, the percentage of households with floor material made with cement declined by more than 20 percentage points.
Changes in Country Context
Changes in the EquityTool often reflect changes in the economic well-being of the population. As the population wealth changes, the prevalence of different assets may change. The following table provides a summary of some key indicators that illustrate how the economic well-being of the population of Dominican Republic has changed from 2013 to 2019.
| Previous Survey: DHS 2013 | Current Survey: MICS 2019 | |
| Percent of the population living below the $2.15 per day poverty line [1] | 2.97% (2013) | 0.83% (2019) |
| Percent of the population that is multidimensionally poor [3] | 3.69% | 2.81% |
| GDP per capita [4] | $15,898 | $21,363 |
| Average annual GDP growth from 2013 to 2019 [5] | 6.06% | |
The Dominican Republic economy grew between 2013 and 2019. Accompanying this economic growth has also been a decrease in the poverty headcount as measured by both the international poverty line and the Multidimensional Poverty Index. This economic improvement, over time, will reduce the previous Dominican Republic EquityTool’s ability to accurately assign households to their most correct wealth quintiles.
Metrics for Management provides technical assistance services to those using the EquityTool, or wanting to collect data on the wealth of their program beneficiaries. Please contact equitytool@m4mgmt.org and we will assist you.
[1] From pip.worldbank.org, reporting poverty headcount ratio at $2.15/day at 2017 international prices.
[2] From the Dominican Republic dataset household recode, available at https://mics.unicef.org/surveys
[3] From Oxford Poverty and Human Development Initiative (October 2024). “Dominican Republic Country Briefing”, Oxford Poverty and Human Development Initiative, University of Oxford.
[4] From data.worldbank.com, reporting GDP per capita, PPP (constant 2021 international $)
[5] From data.worldbank.com, reporting average of GDP growth (annual %)
